TerraLabel
Click on a rooftop in satellite imagery, get a GeoJSON polygon in 200ms. SAM2-powered labeling with human-in-the-loop review — 7x faster than manual digitization with comparable boundary accuracy.
Platform
terralabel.ai
Platform Capabilities
Faster than manual tracing
GPU inference per click
Solar panels labeled in Canberra
To accurate GeoJSON polygon
The Problem: Scaling Geospatial Annotation
A government agency needs 10,000 labeled solar panel outlines to train a detection model. Manual digitization: 3-4 weeks at ~15 minutes per panel. Fully automated segmentation: fast, but error rates above 20% mean re-doing most of the work anyway. Neither approach scales.
Manual Digitization
Accurate but slow. A skilled operator traces ~4 polygons per hour across complex imagery.
Fully Automated
Fast but 20%+ error rate. You spend nearly as long fixing mistakes as you would tracing from scratch.
TerraLabel Approach
AI traces boundaries in 200ms; humans confirm or refine. 7x throughput with manual-grade accuracy.
SAM2 Integration
TerraLabel leverages Meta's Segment Anything Model 2 (SAM2) with Hiera Large backbone. SAM2's image encoding is expensive, but subsequent prompts are cheap—perfect for interactive labeling workflows.
Click-to-Polygon
Single clicks become accurate polygons in ~200ms. SAM2 traces object boundaries automatically, understanding context from surrounding imagery — turning a 15-minute manual trace into a 2-second interaction.
Hiera Large Backbone
SAM2's hierarchical vision transformer handles objects from 10px solar panels to 500px building footprints. The 224MB ONNX model runs on commodity GPUs — no A100s required for interactive-speed inference.
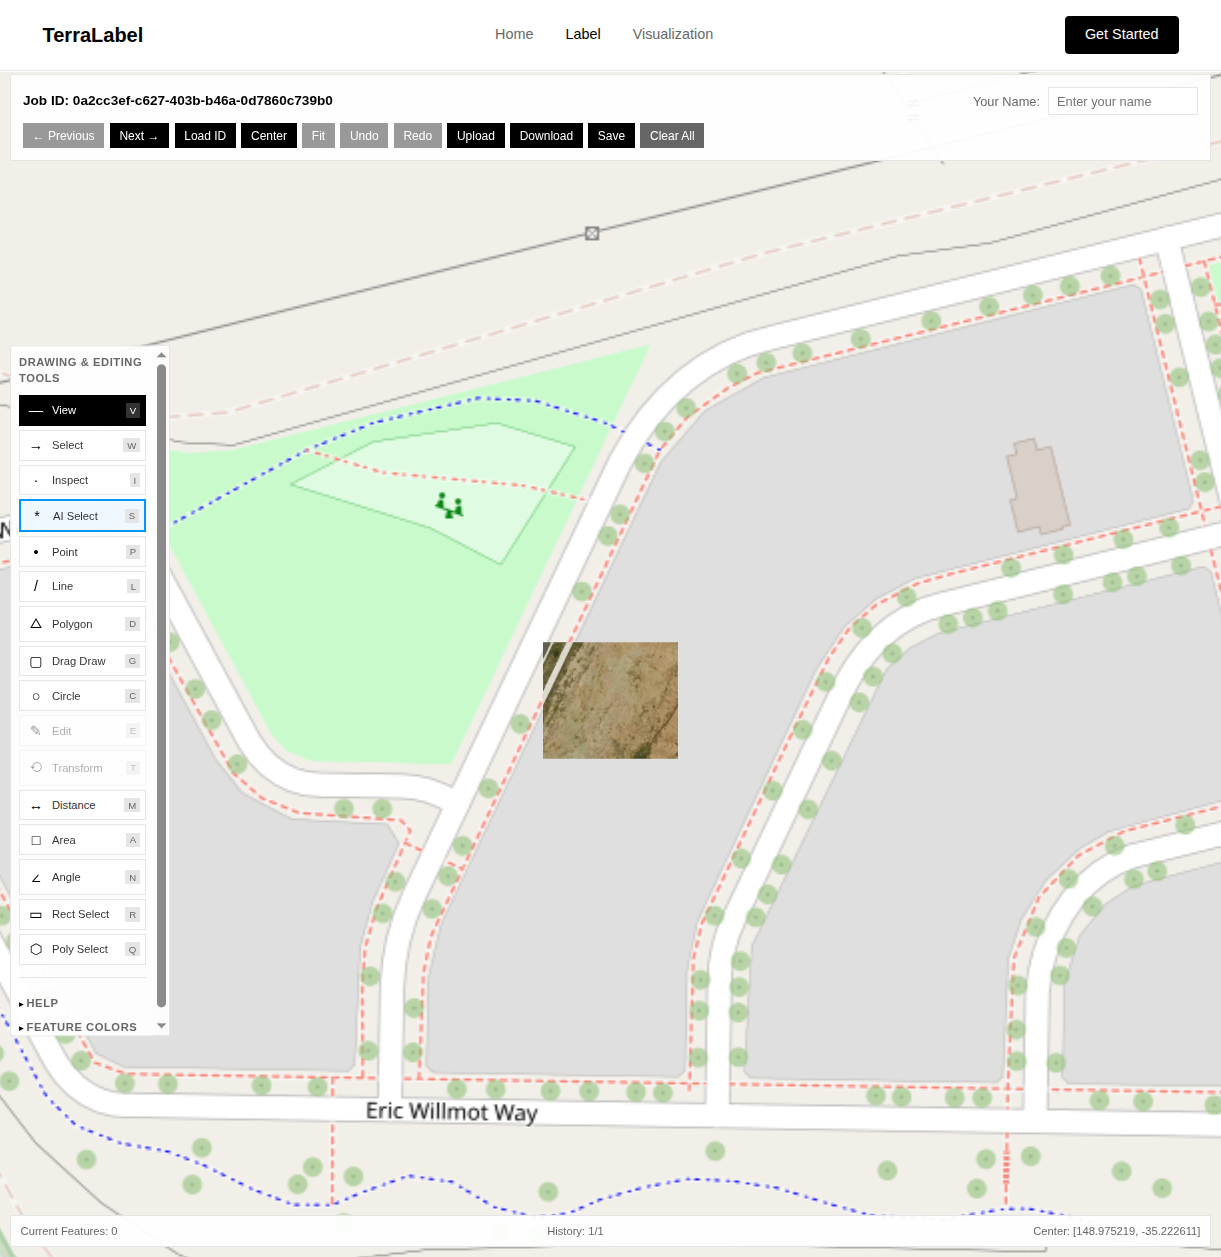
Interactive Labeling Tools
Built on deck.gl's editable layers, TerraLabel provides professional GIS-quality drawing tools in the browser. Switch between modes depending on the annotation task.
AI-Assisted Selection
Single-click SAM2 segmentation traces boundaries in ~200ms on GPU — operators label 28+ features per hour vs. 4 manually.
Manual Drawing Tools
Point, Line, Polygon, Circle, and Drag Draw modes for precise manual annotation when needed.
Undo/Redo History
50-step history with full state preservation. Never lose work due to accidental edits.
Measurement Tools
Distance, Area, and Angle calculations with real-time feedback as you annotate.
Multiple Selection Modes
Rectangle and Polygon selection for bulk operations on multiple features.
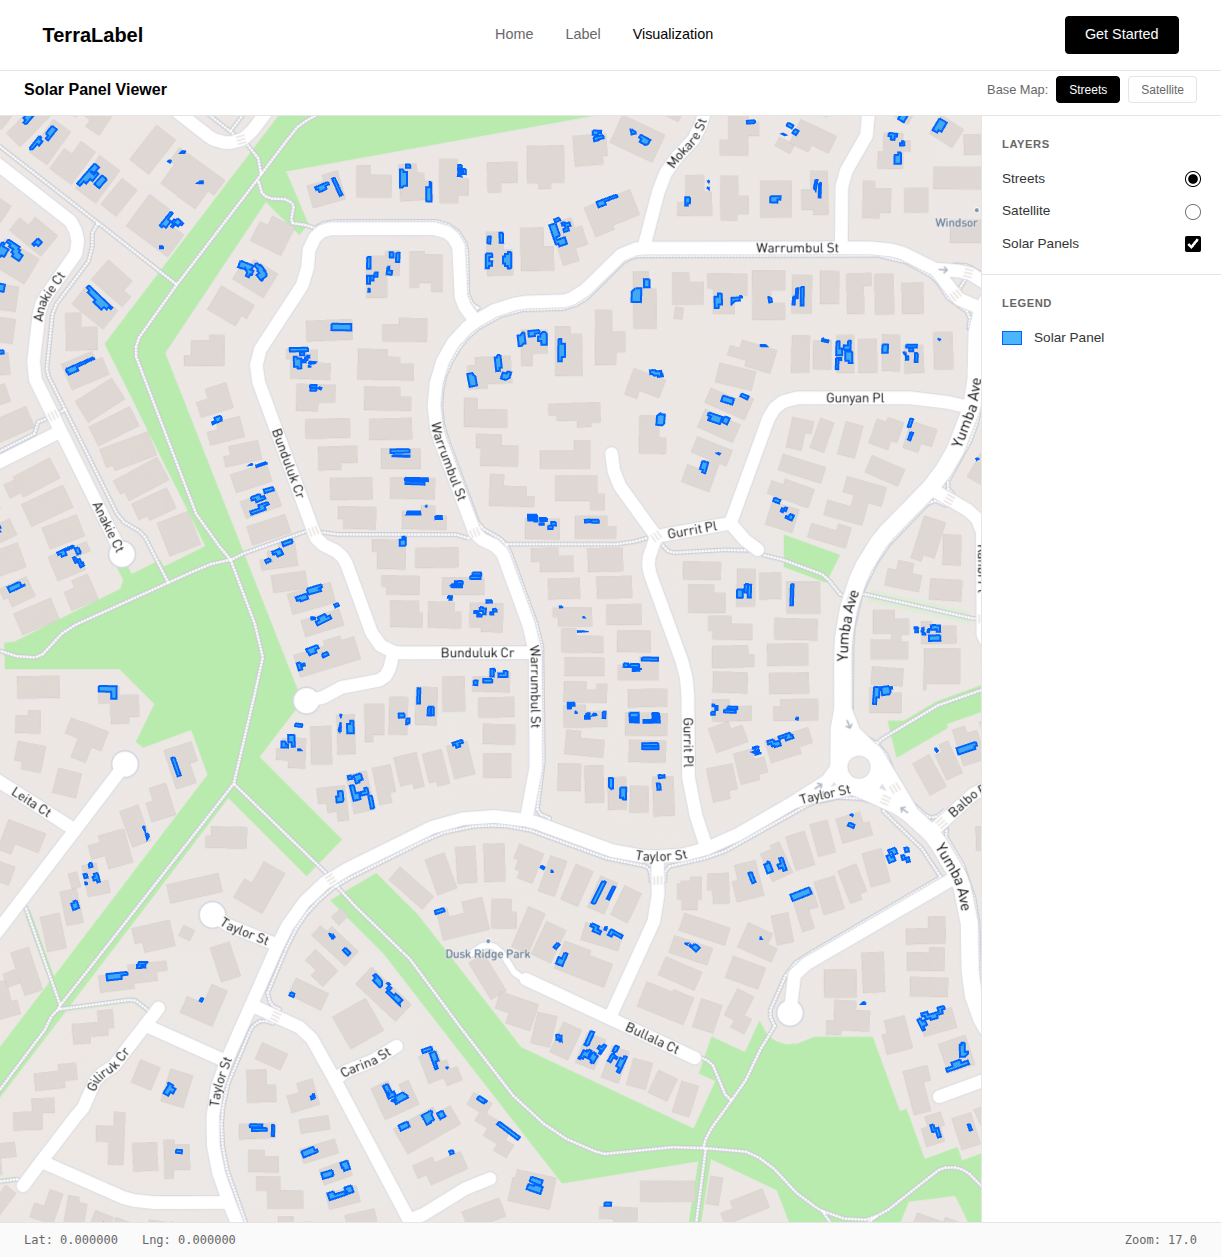
Vector Tile Visualization
View 4,200+ labeled features across study areas via Martin tile server — ~50KB per tile vs. 160MB+ for the full dataset.
Vector Tile Visualization
View 4,200+ labeled features across the entire Canberra study area. Individual tiles are ~50KB compared to loading the full dataset at 160MB+ — the difference between a smooth pan and a frozen browser tab.
Key Learnings
Technical Insights
- SAM2 generalizes to satellite imagery without fine-tuning — boundary IoU above 0.82 on solar panels
- Sub-300ms latency is the threshold for maintaining labeling flow state
- Douglas-Peucker simplification reduces polygon vertices by 60% with <1px boundary deviation
- Vector tiles cut visualization payload from 160MB to ~50KB per viewport — pan stays at 60fps
Production Results
- 4,200+ solar panels labeled across Canberra using ACT 10cm aerial imagery
- 7x faster than manual digitization with comparable boundary accuracy
- Human-in-the-loop workflow reduced error rate from 22% (auto) to under 5%
- GPU inference (~200ms) vs CPU (2-5s) — the difference between interactive and batch-only
Try the live demo
Click on satellite imagery, get a polygon in 200ms. Explore 4,200+ labeled solar panels across Canberra, or label your own features.